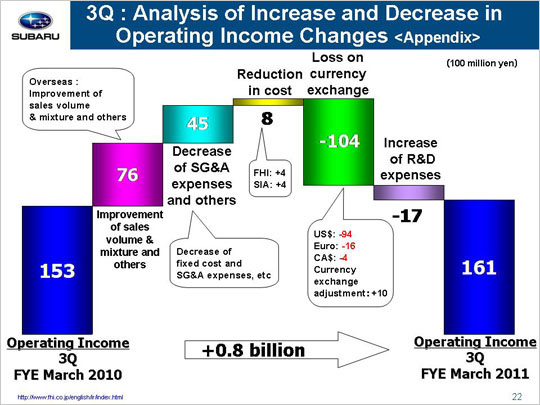
| Now let’s look at the reasons for the year on year increase and decrease in operating income that took us from 15.3 billion yen to 16.1 billion yen. The factors that led to the increase in operating income included a gain of 7.6 billion yen due to an improvement of sales volume and mixture and others. This gain can be broken down into three areas. First, we suffered a loss of 5.0 billion yen in the domestic market due to declining sales triggered by the termination of the eco-car purchase subsidy. Next, we saw a gain of 16.7 billion yen in overseas markets thanks to increased sales volumes in the U.S., Russia, Australia and other markets. Finally, we experienced a loss of 4.1 billion yen due to inventory adjustments and others. A decrease in SG&A expenses and others led to a gain of 4.5 billion yen. This gain can also be broken down into three areas. First of there was a gain of 2.9 billion yen due to reduced fixed manufacturing costs, including gains of 2.7 billion yen at FHI and 0.2 billion yen at SIA. FHI yielded a gain of 1.6 billion yen due to decrease of the depreciation for suppliers’ dies and a gain of 1.1 billion yen due to lower fixed processing costs. SIA gained 0.3 billion yen due to decrease of the depreciation for suppliers’ dies and lost 0.1 billion yen due to increased processing costs. Next, a decrease in SG&A expenses resulted in a gain of 1.5 billion yen. FHI generated a gain of 0.7 billion yen due to a reduction in advertising costs. Domestic dealers also generated a gain of 1.0 billion yen due to ongoing efforts to lower SG&A expenses. SOA, on the other hand, saw a loss of 1.8 billion yen, which included a gain of 0.7 billion yen due to reduced advertising as well as SG&A expenses and a loss of 2.5 billion yen due to increased incentives. The per-unit incentive increased from 600 dollars for October-December 2009 to 850 dollars for October-December 2010 on top of the increased sales volume. Our Canadian subsidiary generated a gain of 0.5 billion yen. Other subsidiaries and others generated gains of 1.1 billion yen. Finally, the third factor includes a decrease in costs associated with warranty claims that led to a gain of 0.1 billion yen. Cost in reduction will generate a gain of 0.8 billion yen, including a gain of 0.4 billion yen at FHI and a gain of 0.4 billion yen at SIA. FHI is expected to generate a gain of 2.4 billion yen with losses amounting to 2.0 billion yen due to increased materials costs and other adverse market factors. SIA is expected to generate a gain of 1.2 billion yen and a loss of 0.8 billion yen related to rising material prices and other unfavorable market conditions. Operating income shrunk by 10.4 billion yen due to foreign exchange losses. This included a loss of 9.4 billion yen due to an approximate 7 yen appreciation against the U.S. dollar, a loss of 1.6 billion yen due to an approximate 21 yen appreciation against the euro, and a loss of 0.4 billion yen due to an approximate 4 yen appreciation against the Canadian dollar. This figure also includes a gain of 1.0 billion yen due to foreign exchange adjustments for transactions between FHI and its overseas subsidiaries. We saw a loss of 1.7 billion yen due to increased R&D expenses that rose from 9.7 billion yen to 11.3 billion yen for developing new models and more environmentally friendly features. These factors combined brought operating income up 0.8 billion yen. |